Web application that enables users to upload CSV datasets and create customizable, interactive visualizations with ease. With a modern interface and robust data processing, it’s an ideal tool for data exploration and analysis.
Choose from a diverse set of visualizations, including line, bar, scatter, pie, doughnut, radar, histogram, box, violin, heatmap, and more, to suit various data analysis needs.
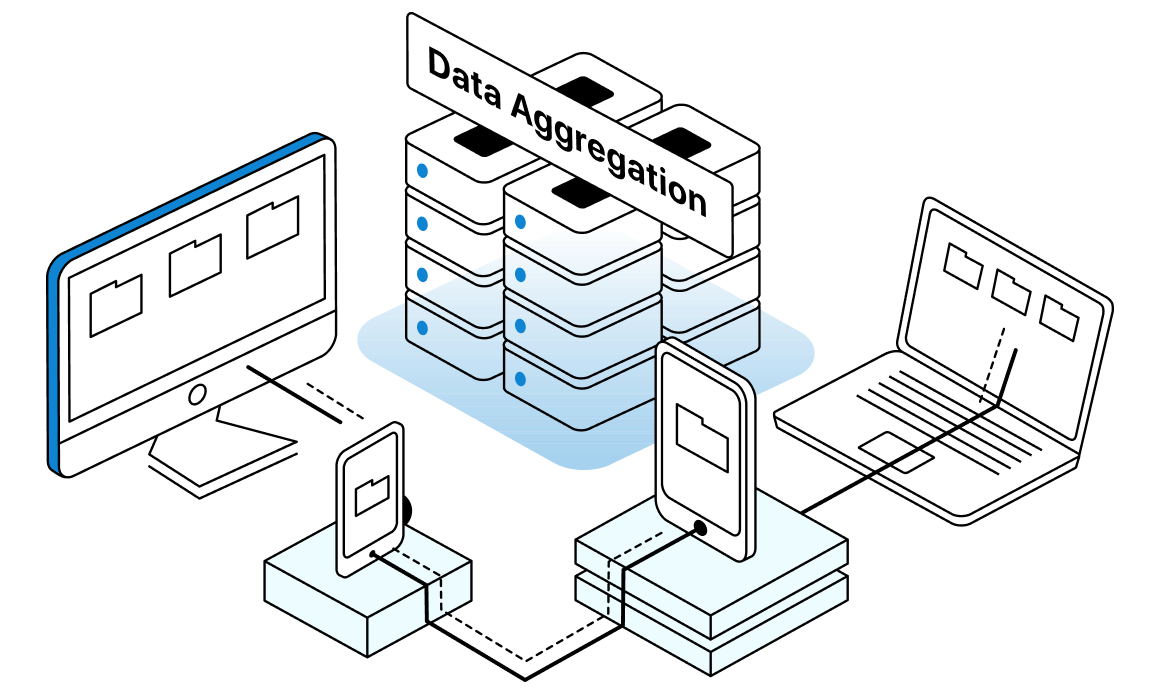
Beyond basic cleaning, JNash supports advanced transformations like feature engineering, outlier detection, aggregation, and dataset reshaping — enabling analysts and data scientists to create ML-ready features without leaving the platform.